
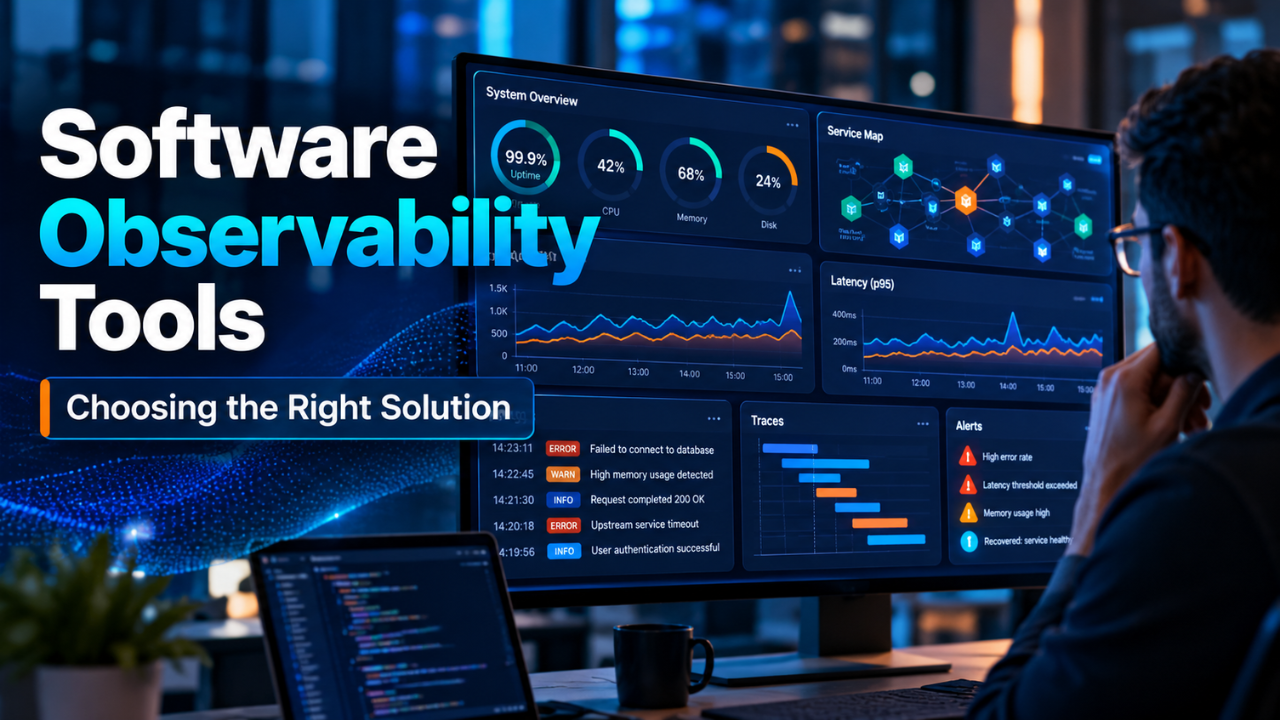
Software Observability Tools: How to Choose the Right Ones
A checkout page starts loading slowly. Customers see a spinner, support tickets begin to arrive, and your team opens three different dashboards. One shows normal server health. Another shows a rise in errors. A third has thousands of log lines, but none clearly explains what a customer experienced.
That’s the sort of moment software observability tools are meant to help with. They collect clues from your application and make it easier to follow a problem across services, databases, and infrastructure. The right setup won’t prevent every outage, but it can help your team find the cause sooner and make decisions with less guesswork.
Table of Contents
- What software observability tools actually do
- The signals that help explain a problem
- The main types of observability tools
- Why tools need to work together
- How to evaluate software observability tools
- Open source, hosted, or hybrid?
- Common mistakes to avoid
- A practical way to get started
- The best setup is the one your team can actually use.
What software observability tools actually do
Observability tools help you understand what’s happening inside software by looking at the data the system produces. That can include how long requests take, which services they pass through, what errors occur, and how the underlying servers or containers are behaving.
This is related to monitoring, but the two ideas aren’t quite the same. A monitor might tell you that error rates have crossed a threshold. Observability helps you investigate why: perhaps a particular service is timing out, a database query has slowed down, or one region is seeing a spike in failed requests.
That distinction matters when an application has several moving parts. In a small app, a developer may be able to check one server and find the issue. In a system spread across cloud services, queues, APIs, and databases, a single alert rarely tells the whole story.
A useful tool gives engineers enough context to move from “something is wrong” to “this specific request became slow after it reached this service.” It makes the path through a system easier to see.
The signals that help explain a problem
Most observability setups rely on three core signals: metrics, logs, and traces. OpenTelemetry, an open-source framework for collecting and exporting telemetry, describes these as distinct signals that can be used to understand software behavior.
Metrics are numerical measurements collected over time. Request latency, CPU use, memory consumption, and the number of failed payments are all examples. They’re good at showing trends and helping teams spot a change. If the average response time suddenly doubles, a metric can make that visible quickly.
Logs record events. A log entry might say that a payment request failed because a bank’s API returned an error. Logs can provide useful detail, but they become hard to work through if they’re inconsistent, noisy, or missing key context.
Traces follow a request as it travels through parts of an application. Imagine someone searches for a product, loads a recommendation service, then adds it to a cart. A trace can show how much time each step took and where the request stalled.
Each signal answers a slightly different question. Metrics show that something changed. Logs offer details about events. Traces help show where the request went. When they’re connected—for example, when a trace ID appears in a relevant log—an engineer can move from a high-level warning to the records tied to one slow request.
The main types of observability tools
The observability category includes several kinds of tools. Some gather data; others store it, search it, visualize it, or send alerts. Many platforms combine these jobs, but it helps to understand what each part is for.
Application performance monitoring (APM) tools focus on application behavior. They can help teams see which endpoints are slow, how often errors occur, and which dependencies are involved. APM can be especially helpful when a problem appears inside application code rather than on the host machine.
Infrastructure monitoring tools focus on the resources the software runs on: servers, containers, databases, and cloud services. When an application slows down, this data helps answer practical questions such as whether a host is short on memory or a database is approaching its connection limit.
Log management tools collect and search log data. Their value depends partly on whether logs are structured and searchable. If every service records errors in a different format, investigations tend to take longer.
Distributed tracing tools make it easier to inspect requests across multiple services. They’re particularly useful for teams working with microservices, where an operation may cross several internal and external systems before it finishes.
Real user monitoring and synthetic monitoring look at application performance from a user-facing angle. Real user monitoring uses information about actual user experiences. Synthetic monitoring runs planned checks, such as loading a page on a schedule, to catch failures between real visits.
Some widely used tool names include Grafana, Prometheus, Datadog, New Relic, Dynatrace, and Jaeger. They don’t all serve the same role, and their capabilities can vary by product and plan. It’s more useful to compare what your team needs—such as trace search, alerting, or log retention—than to treat every familiar name as a complete replacement for every other one.
Why tools need to work together
Collecting data is only part of the job. Engineers also need to connect it to the system and request it describes. A dashboard can show a latency spike, but the next step is much easier if someone can jump from that metric to a trace, then inspect the related logs.
This depends on good instrumentation: the code and services need to emit useful data in a reasonably consistent way. If one service labels itself checkout-api and another calls the same service payments-checkout, cross-service searches may become confusing. Clear service names, environment labels, timestamps, and request identifiers make data easier to follow.
OpenTelemetry can help standardize how telemetry is generated and moved between systems. Its Collector can receive, process, and export telemetry data, giving teams a way to route data to observability backends. OpenTelemetry itself isn’t a storage or visualization backend; teams still need a place to analyze the data they collect.
That separation can be useful if a team expects its observability needs or vendors to change. Still, standardizing instrumentation doesn’t automatically make every tool interchangeable. Some platforms offer their own dashboards, query features, or workflows, so it’s wise to check how the whole setup works together.
How to evaluate software observability tools
Start with the problems your team actually needs to investigate. A small product team may mostly need clear error alerts and application traces. A larger organization might need access controls, long-term data retention, audit requirements, and a way to manage data from many engineering teams.
Consider these questions as you compare options:
- What can the tool help you find? Look for support for the data and workflows your team needs, including relevant metrics, logs, traces, and alerts.
- How quickly can someone investigate? Try a realistic scenario: start with an alert for slow checkout requests and see how many steps it takes to find the likely cause.
- Does it fit your environment? Check the languages, cloud services, containers, and databases your software depends on.
- Can your team use it comfortably? A powerful system still takes time to learn. Query languages, dashboard setup, and access management can affect how readily the team adopts it.
- What will the data cost to keep and search? Ingesting high volumes of telemetry can raise costs. Sampling, retention settings, and data selection may affect how much you pay and how much detail remains available.
- Can you export or route data cleanly? Consider whether the tool fits your existing pipelines and how much work would be involved if your requirements change.
The best evaluation is a focused trial using your own application. Set up a small, end-to-end workflow: generate telemetry, search it, create an alert, and investigate a known issue. That tells you more than a polished dashboard demo.
Open source, hosted, or hybrid?
Open-source tools can offer flexibility and control over where data is stored. A team with infrastructure experience may prefer to assemble a stack from separate tools for collection, storage, queries, and dashboards. The trade-off is that someone needs to operate and maintain those parts.
Hosted observability platforms generally take on more of the infrastructure work. That can make it easier to get started, though pricing, data location, retention limits, or vendor-specific workflows may matter for your team. Read the current plan details and test the tasks you expect to use; a feature listed on a product page may not be included in every plan.
A hybrid setup is also common: teams use open standards or collectors for instrumentation and routing while relying on hosted tools for analysis. Grafana’s documentation, for example, describes its software as a way to explore and visualize data from supported sources. There’s no universal winner here. The sensible choice depends on how much operational work your team wants to own and what control it needs.
Common mistakes to avoid
The first mistake is collecting everything without deciding what’s useful. High-cardinality data—such as a unique user ID attached to every metric—can make data harder to manage and may increase storage or query costs. Keep sensitive information out of telemetry, too; logs and traces can accidentally include personal details, access tokens, or payment data.
Another common problem is alert overload. If an alert fires often but rarely requires action, people learn to ignore it. Alerts should point to a condition that needs attention and include enough context to help someone choose the next step.
Teams can also spend too much time polishing dashboards before they’ve figured out how they’ll investigate an incident. A dashboard is a useful starting point, but it can’t replace clear instrumentation, sensible alert rules, or the ability to search for details.
Finally, treat observability as part of the software’s upkeep. Services change, teams add new dependencies, and old dashboards can drift out of date. Reviewing telemetry during normal development helps prevent the monitoring setup from falling behind the application.
A practical way to get started
Choose one user-facing workflow that matters, such as login, search, or checkout. Add basic metrics, structured logs, and tracing around its key steps. Make sure the signals share consistent service and environment details so the team can connect them during an investigation.
Then test a real question: why did checkout slow down yesterday afternoon? Can an engineer find the affected requests, see which part took the longest, and inspect relevant errors without switching blindly between tools? If not, identify the missing connection and improve that part first.
Expand gradually. Add useful alerts, then cover the next important workflow. This keeps the initial setup manageable and shows whether your chosen tools are helping with the problems your team actually has.
The best setup is the one your team can actually use.
Software observability tools are most valuable when they help engineers answer specific questions about the software they run. Metrics, logs, and traces each reveal a different part of the picture, but their combined value depends on useful instrumentation and clear connections between them.
Start with one important workflow, test how your team investigates it, and build outward from there. A modest setup that helps people find real problems is a better foundation than a large collection of dashboards no one trusts.

One Comment