
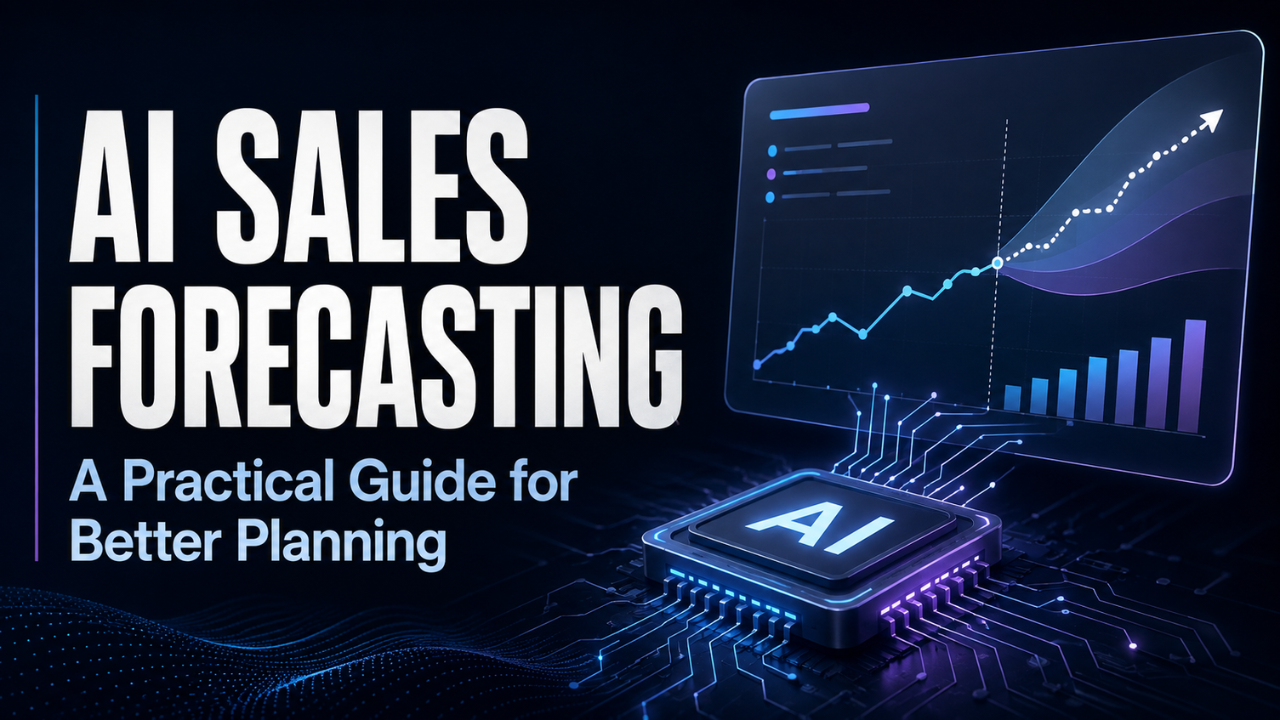
AI Sales Forecasting: A Practical Guide for Better Planning
Your sales team expects a strong month. The pipeline looks healthy, two big deals seem close, and someone has already mentioned hiring another account manager.
Then one buyer goes quiet. Another pushes the decision into next quarter. Suddenly, the number everyone trusted starts falling apart.
AI sales forecasting can help you spot those weaknesses earlier. It looks for patterns across past results and current sales activity, giving your team another way to judge what’s likely to happen. Its value depends on whether those predictions help you make better decisions while there’s still time to act.
Table of Contents
- What AI Sales Forecasting Actually Does
- Start by Deciding What You’re Forecasting
- How the Forecast Takes Shape
- Your Sales Data Needs Some Housekeeping
- What Better Forecasts Change in Practice
- Give Every Number Some Breathing Room
- Test It Before You Trust It
- Choose Tools Your Team Will Actually Use
- Make Forecast Reviews Worth Having
What AI Sales Forecasting Actually Does
AI sales forecasting uses methods such as machine learning to estimate future sales from historical data and relevant business signals. Depending on the setup, those signals might include seasonal demand, deal progress, customer activity, and past buying patterns. Salesforce’s forecasting guide explains these foundations.
A simple forecast might take last month’s sales and add 10%. Another might multiply every open deal by a fixed probability based on its sales stage.
A learning model can look at more detailed relationships. Perhaps large deals in one customer segment usually take longer than expected. Maybe repeat buyers move quickly once they request a quote.
That extra detail can help, but complexity alone proves nothing. A straightforward forecast may work perfectly well for a stable business. The more advanced approach earns its place when it produces more useful predictions on your actual sales.
Start by Deciding What You’re Forecasting
Before choosing software, agree on what the number means.
Are you predicting signed contracts, product units, revenue earned during the month, or money arriving in your bank account? These measures answer different questions.
Imagine an agency signs a $12,000 contract in June for work spread over several months. The contract value, monthly revenue, and payment dates won’t necessarily match. Mixing them creates confusion before any model gets involved.
Choose a clear scope, such as new contract bookings for the next quarter. Define the team, products, currency, and treatment of cancellations.
Keep the sales target separate, too. A target describes what you want to achieve. A forecast estimates what current evidence supports. If leadership keeps adjusting the prediction until it matches the target, the exercise loses its purpose.
How the Forecast Takes Shape
Different sales models need different approaches.
A retailer may forecast weekly sales by studying how demand changes over time. A business selling large contracts may focus on individual opportunities: whether they’ll close, when they’ll close, and how much they’ll be worth.
Microsoft’s predictive forecasting documentation, for example, describes estimates based on historical close rates and the current pipeline, including deals likely to slip into another period. Microsoft Learn
Consider a simplified example. An $80,000 opportunity has an estimated 60% chance of closing this quarter. Multiplying the value by that probability gives a weighted contribution of $48,000.
That doesn’t mean the customer will buy $48,000 of the contract. The deal may close at its full value or bring in nothing this quarter. The weighted amount helps build an overall expectation across opportunities.
Timing matters just as much as winning. A deal can be highly likely to close eventually and still be unlikely to land before your reporting deadline.
Your Sales Data Needs Some Housekeeping
Let’s be honest: plenty of sales records describe what someone hopes will happen.
An old opportunity stays open because nobody wants to mark it lost. A close date moves forward every month. Two records describe the same customer conversation.
Start there.
Remove duplicates, review stale deals, and agree on what each sales stage means. “Proposal sent” should represent the same milestone across the team. Keep lost opportunities in the history so the model can learn from unsuccessful deals as well as wins.
Preserve dated snapshots, too. Today’s completed record doesn’t show exactly what your team knew six weeks ago. That history matters when you later test old predictions.
There’s no universal amount of data that guarantees success. You need enough relevant examples for the patterns you want to learn. A business with a handful of unusual contracts should be cautious about drawing strong conclusions from them.
What Better Forecasts Change in Practice
A useful forecast gives people time to respond.
Suppose an agency expects several projects to start next month. A revised forecast suggests that two large contracts will probably arrive later. The operations manager can review contractor schedules before committing to unnecessary capacity.
A sales manager can use the same information differently. If an important deal appears likely to stall, they can ask what’s missing: buyer approval, a technical review, or a clear next meeting.
The prediction identifies something to investigate. The team still needs to find the cause.
I’d also watch how the tool affects meetings. If people spend less time collecting updates and more time resolving specific obstacles, that’s a practical benefit worth measuring alongside accuracy.
Give Every Number Some Breathing Room
A forecast of $497,362 looks impressively precise. That precision can be misleading when a single customer could shift the result by $100,000.
Ask for a range where the tool supports one, and check what that range represents. A statistical prediction interval should have a stated coverage level and a history of being tested against actual outcomes.
You can also build scenarios around specific assumptions. What happens if your biggest deal slips? What changes if renewals come in below expectations?
These scenarios help people plan, but they aren’t automatically statistical probability ranges.
Be especially careful after a major price change, product launch, or shift in your customer base. Patterns learned from the old business may fit the new one poorly. Record those changes and review whether the forecasts still hold up.
Test It Before You Trust It
Run the new approach alongside your current forecast before making it central to planning.
Choose a simple comparison, such as last year’s equivalent month, a recent average, or your existing weighted pipeline. Give both methods the same information and ask them to predict the same period.
Test several past periods using only information available at each prediction date. For example, predict April from records available at the end of March, then move forward and repeat. This follows the principle of time series cross-validation. Forecasting: Principles and Practice
Measure error in terms people understand. If you predicted $200,000 and closed $180,000, the absolute error was $20,000. Track typical errors over multiple periods and check whether forecasts repeatedly run too high or too low.
Look beneath the company total. Overestimating one team by $40,000 and underestimating another by $40,000 makes the overall result look perfect while both teams receive poor guidance.
Compare forecasts made at the same point in time. A prediction made two days before quarter-end has a different job from one made three months earlier.
Choose Tools Your Team Will Actually Use
Start with the systems that already hold your sales information.
A forecasting feature inside your customer relationship management system may be easier to maintain than a separate platform requiring repeated exports. A dedicated product may make sense when you need to combine several systems or support more complex planning.
During a trial, ask the supplier to demonstrate a forecast using your records. Can you see why the number changed? Can managers record adjustments? Can you export dated predictions for later checking?
Find out how often predictions refresh. A frequently updated dashboard doesn’t necessarily mean the underlying forecast recalculates just as often.
Include setup, data cleanup, training, and ongoing administration when assessing the cost. A tool that demands hours of manual repair every week may struggle to justify its place.
Make Forecast Reviews Worth Having
Give someone responsibility for the forecast and establish a review rhythm that fits your sales cycle. Weekly reviews may suit an active pipeline, while longer deals may need a different schedule.
Focus the conversation on changes. Which assumptions weakened? Which deals moved? What does someone need to do before the next review?
Allow informed human adjustments, but save the original prediction and record the reason. “The buyer confirmed a procurement delay” gives you something to evaluate later. “This number feels low” gives you much less.
The real value of AI sales forecasting comes from combining useful predictions with honest records and thoughtful follow-through. Start with one clear sales question, test the answers, and build from there. You’ll still face surprises. The aim is to spot more of them early enough to respond well.





One Comment