
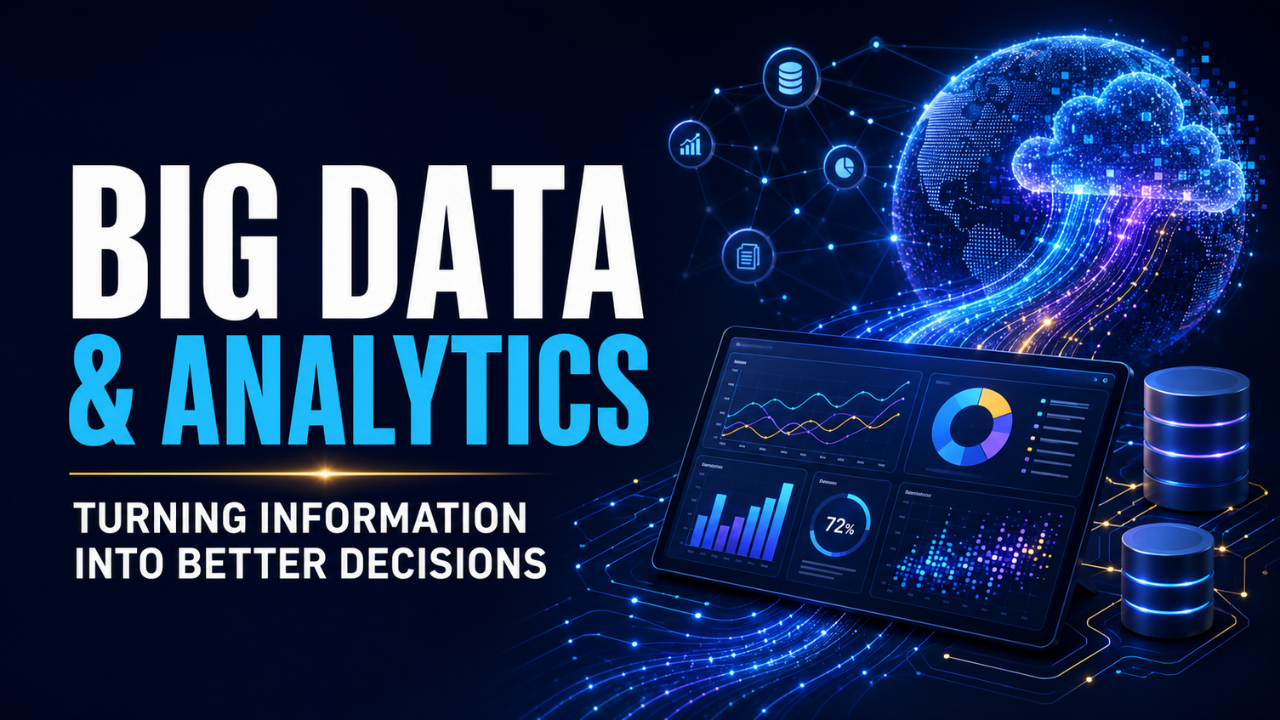
Big Data & Analytics: Turning Information Into Better Decisions
Every business collects data, even when nobody calls it that. A café tracks busy hours. An online store records abandoned carts. A delivery company knows which routes run late. The challenge is working out what that information is trying to say.
That’s where Big Data & Analytics becomes useful. It turns large, fast-moving, and often messy datasets into patterns people can act on. Done well, it can reveal why customers leave, where money is wasted, or which small change could improve an operation.
Still, let’s be honest: more data doesn’t automatically lead to better decisions. The value comes from asking sensible questions, using reliable information, and connecting the findings to real work. When those pieces line up, analytics becomes a practical way to see a business more clearly.
Table of Contents
- What Big Data & Analytics Really Means
- Why “Big” Is Only Part of the Story
- How Raw Data Becomes a Useful Decision
- Where Analytics Earns Its Keep
- Better Questions Beat Bigger Dashboards
- The Problems Hidden Behind Clean Charts
- A Sensible Way to Get Started
- Data Still Needs Human Judgment
- Turning Information Into Everyday Value
What Big Data & Analytics Really Means
Big data refers to information that’s too large, too fast, too varied, or too complicated for traditional methods to handle comfortably. It may include sales records, website activity, sensor readings, customer reviews, location data, images, support conversations, and countless other digital signals.
Analytics is the process of examining that information to find something useful. Sometimes the goal is descriptive: what happened last month? Sometimes it’s diagnostic: why did returns suddenly rise? More advanced work may predict what’s likely to happen next or recommend a specific action.
Picture a supermarket with hundreds of branches. Millions of receipts, viewed alongside weather, promotions, locations, and stock levels, can reveal why a product sells quickly in one area but not another. The numbers haven’t made the decision. They’ve made the situation easier to understand.
That distinction matters. Big data is the raw material; analytics is how people create meaning from it.
Why “Big” Is Only Part of the Story
People often imagine big data as an enormous pile of records. Size matters, but so does speed. A bank watching for suspicious transactions can’t wait weeks for a report. It must spot unusual behavior while the payment is happening.
Variety creates another challenge. Spreadsheet rows, emails, recordings, photos, and customer comments don’t naturally fit together. They must often be cleaned and matched before analysis begins.
Then there’s reliability. Ten million incorrect records aren’t more valuable than one thousand accurate ones. In fact, they’re more dangerous because the result may look convincing. A large dataset can create false confidence when nobody checks where it came from, what’s missing, or whether it still reflects current conditions.
Data becomes “big” when its scale, speed, or complexity requires a different way of storing, processing, and understanding it.
How Raw Data Becomes a Useful Decision
Useful analytics usually begins with a business question, not a tool. Suppose a subscription company notices that cancellations are rising. “Analyze our customer data” is far too broad. A sharper question would be: “What do customers who cancel within 60 days have in common?”
Now the team has direction. It can compare sign-up sources, product usage, support requests, billing problems, and cancellation feedback after correcting duplicates and inconsistent labels.
The team might discover that early cancellations are common among customers who never complete a key setup step. Perhaps the screen is confusing, or customers don’t understand why it matters.
Finally, someone has to act. The company could simplify onboarding, add a timely reminder, and compare cancellation rates before and after the change. Many analytics efforts fail here: the team discusses a polished report, then returns to its usual routine.
A useful insight changes a choice. If nothing is done differently, the analysis has produced information, not value.
Where Analytics Earns Its Keep
The strongest uses of analytics are often less glamorous than people expect. They solve specific, expensive problems.
In retail, demand forecasting helps stores stock the right products without filling warehouses with unwanted items. A clothing retailer might discover that rainy weather affects weekend sales more strongly than expected seasonal trends. Adjusting stock around short-term forecasts could reduce missed sales and heavy discounts.
Manufacturers use equipment data to spot wear before a machine fails. A small rise in temperature or vibration might signal that a part needs attention, allowing maintenance to happen before an expensive shutdown.
Customer service offers a simple example. Imagine a company receiving thousands of complaints. Analysis might show that “late delivery” complaints cluster around one warehouse, one courier, and orders placed after a certain time. Suddenly, a vague customer problem has an operational address.
That’s the real strength of analytics: it narrows uncertainty enough for someone to take a focused step.
Better Questions Beat Bigger Dashboards
A common mistake is measuring whatever happens to be easy. Page views, app downloads, total orders, and open rates all have their place, but they can become vanity metrics when separated from a clear goal.
Consider an online shop celebrating a jump in website traffic while sales stay flat. The traffic number looks healthy, yet the business outcome is unchanged. Better questions would examine who those visitors are, where they leave, and whether the campaign attracted the wrong audience.
Good questions connect activity to outcomes. Did faster support improve customer retention? Did a price change increase profit after returns and discounts were considered? Did a new delivery promise create more repeat orders, or simply raise costs?
Here’s the thing: a small dashboard built around five meaningful questions is often more useful than one filled with fifty charts. Without clear signals and the freedom to act on them, reporting becomes decoration.
The Problems Hidden Behind Clean Charts
Charts make data feel tidy. Real-world information rarely is.
Two systems may assign different IDs to the same customer. A form change can make this year’s results difficult to compare with last year’s. Survey feedback may also overrepresent people with unusually strong opinions.
Bias can enter through the data itself. Historical records reflect earlier decisions, including unfair ones. Treating those records as neutral truth may repeat the same problems at a larger scale.
Privacy deserves equal attention. Businesses should know what they collect, why they need it, who can access it, and when it should be deleted. Secure storage, clear access controls, and lawful consent are part of trustworthy analytics, not background paperwork.
Interpretation creates another trap. Correlation doesn’t prove cause. Ice cream sales and sunburn cases may rise together because warm weather influences both. Business data contains similar traps, and a confident trend line can’t remove them.
A Sensible Way to Get Started
Organizations don’t need to collect everything or rebuild their systems on day one. Starting with one useful problem is usually smarter.
Choose a question connected to a real outcome, such as reducing delays or product returns. Define success and decide what action the team could take. If there’s no possible response, the question probably isn’t ready.
Next, audit the information already available. A quick review often reveals that the biggest obstacle isn’t advanced analysis but inconsistent data entry or systems that don’t communicate.
Run a small project and measure what changes. A restaurant worried about slow evening service could compare order times, staffing, menu choices, and reviews at a few locations. If one overloaded kitchen station is the problem, it can test a staffing adjustment before expanding the approach.
Assign ownership as well. Someone must be responsible for the data, the analysis, and the final decision. Those roles may belong to one person in a small company. What matters is that somebody owns the next move.
Data Still Needs Human Judgment
Analytics can identify patterns people would struggle to see alone, but it doesn’t understand every local detail. A sudden drop in store visits might look alarming until a manager explains that road construction blocked the entrance. A sales spike may appear to validate a campaign, while the finance team knows it came from heavy discounting that damaged margins.
Experienced staff bring context and knowledge that may never appear in a database. Their observations shouldn’t automatically overrule evidence, but the best decisions often combine measured patterns with informed judgment.
Analysts should explain what they found, how certain they are, and what limitations remain. Decision-makers should ask questions without demanding impossible certainty. “The data suggests” is often more honest than “the data proves.”
Turning Information Into Everyday Value
Big Data & Analytics works best when it becomes part of ordinary decision-making rather than a special event. The goal isn’t to admire the amount of information a company owns. It’s to notice problems earlier, understand customers better, test ideas more carefully, and make choices with less guesswork.
That takes solid data, clear questions, responsible handling, and people willing to act on what they learn. It also requires humility. Not every pattern matters, and not every answer will be certain.
Start small. Pick a costly or frustrating question, use the information you already have, and connect the result to one real decision. That’s how analytics proves its value—not through bigger databases or brighter dashboards, but through better choices made at the right moment.
Meta description: Discover how big data and analytics turn complex information into smarter decisions, practical insights, stronger operations, and better customer experiences.
2 Comments