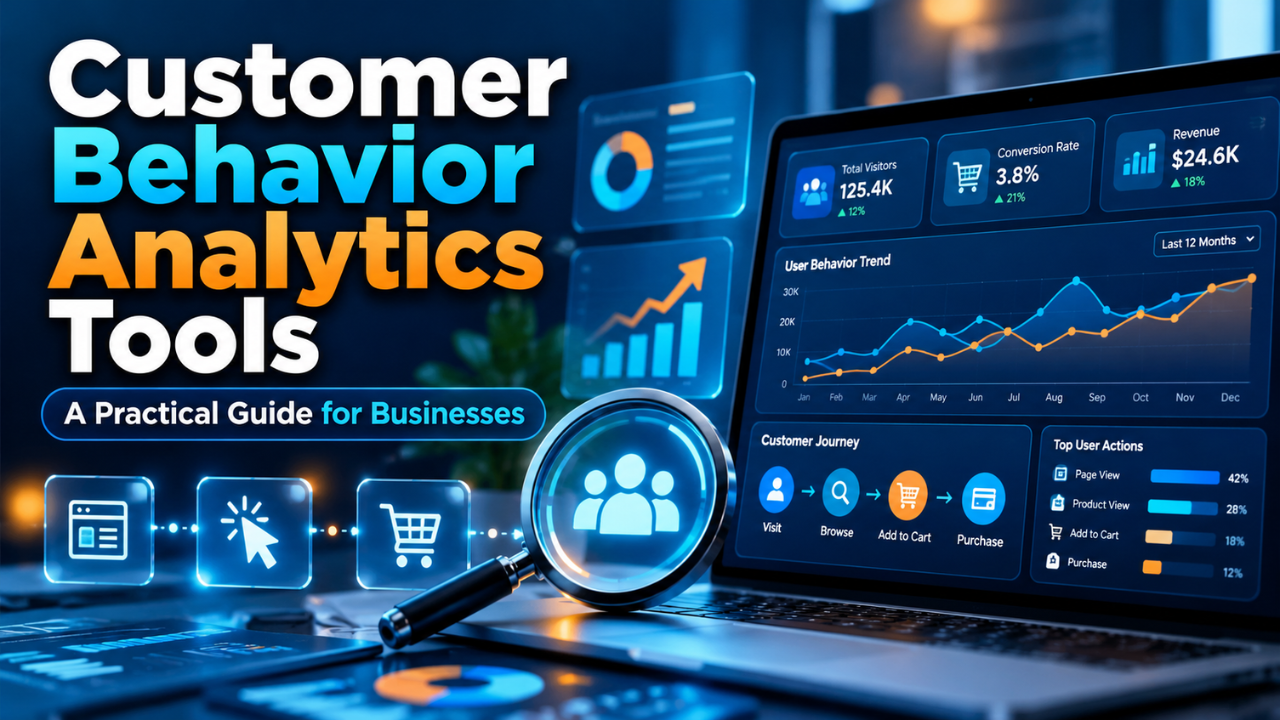
Customer Behavior Analytics Tools: A Practical Guide for Businesses
People rarely explain why they leave a website. They browse a few products, open the delivery page, hesitate at checkout, and disappear. You see an abandoned cart. They experienced something that made buying feel difficult, expensive, or uncertain.
Customer behavior analytics tools help you investigate that gap. They show which actions people take, where journeys break down, and whether customers return after their first visit.
The useful part comes when those patterns lead to a better experience. A clearer form, an earlier delivery estimate, or a simpler first step can be more valuable than another dashboard full of numbers.
Table of Contents
- What Customer Behavior Analytics Tools Actually Show
- The Reports Worth Looking At
- Four Tools to Consider
- How to Choose Without Overbuying
- Build a Small, Reliable Tracking Plan
- Turn a Finding Into a Test
- Read the Numbers With Some Caution
- Make It a Useful Weekly Habit
What Customer Behavior Analytics Tools Actually Show
These tools collect information about interactions with your website, app, or digital service. An interaction might be a product view, a search, a button click, a completed registration, or a repeat purchase.
Individual actions become more useful when you connect them. Someone viewing a pricing page tells you a little. A pattern of visitors moving from pricing to frequently asked questions, then leaving without registering, gives you something specific to investigate.
Different tools reveal different parts of that experience. Event analytics count actions and connect them into journeys. Heatmaps summarize clicks or scrolling. Session replay reconstructs captured interactions so you can inspect how a page behaved for a visitor.
Still, behavior gives you clues about motivation. It doesn’t provide a direct explanation. Customer conversations and usability testing help fill that gap.
The Reports Worth Looking At
A funnel follows a sequence toward an outcome. For an online shop, that could mean viewing a product, adding it to the cart, starting checkout, and purchasing.
Suppose 500 people add something to their cart, but only 100 begin checkout. That gap deserves attention. You might investigate delivery charges, account requirements, or a cart button that behaves badly on mobile.
Retention reports help you understand whether customers return and continue taking meaningful actions. Define that valuable action carefully. Opening an app is weaker evidence of continued usefulness than completing another task or placing another order.
The right interval matters, too. A grocery service might examine weekly purchasing. A business that sells replacement appliances needs to evaluate customer behavior over a longer period.
Segmentation lets you compare groups, such as first-time visitors and returning customers. An overall conversion rate can hide a problem affecting only one device type or acquisition channel.
Then there are heatmaps and session replays. These can help you investigate a confusing menu or overlooked form field. A heatmap shows interaction patterns; scrolling past something doesn’t establish whether someone read or understood it.
I find these reports most useful together. Use the numbers to locate a problem, then inspect relevant sessions and ask customers what happened.
Four Tools to Consider
Google Analytics 4 is worth considering when your questions involve website journeys and conversion steps. Its funnel explorations let you define a sequence and examine where users drop out. Path exploration helps you investigate the routes people take before or after a selected page or event.
For a service business, that could mean following visitors from a service page to an enquiry form and then a successful submission. You’ll need to configure the relevant events before those reports become useful.
Microsoft Clarity offers heatmaps and session recordings, making it an option for investigating how visitors interact with a website. You can review captured clicks, scrolling, and navigation, then narrow your investigation using session filters.
Imagine visitors repeatedly clicking a product image because they expect it to expand. Watching that behavior gives you a practical design question to test. The recording itself won’t tell you whether a larger image would increase purchases.
Mixpanel deserves a look when your questions focus on sequences of actions and continued product use. Its funnel reports show how users move through each stage of the conversion process, while retention reports measure how often they return to complete a specific action.
A subscription service could investigate whether customers who complete an initial setup task return to use the service the following week. That relationship is a starting point for investigation, rather than proof that setup caused their return.
Amplitude is another option for analyzing product journeys. Its funnel analysis measures progress through a sequence, with settings that affect how users and conversions are counted. Understanding those settings matters when you’re comparing reports.
If you’re comparing Amplitude with Mixpanel, build the same small report in both. See whether the people who will actually use it can answer a real business question without constant help.
How to Choose Without Overbuying
Start with a question you need answered this month. “Where do mobile visitors abandon our booking form?” provides a more specific direction for choosing the right tool than simply saying, “We need to understand our customers better.”
Then consider who will maintain the setup. A tool may look straightforward during a demonstration but still require developer time to define events, connect identities, and repair tracking after changes.
Check how the platform charges as usage grows. Depending on the provider and plan, costs may relate to users, events, sessions, or additional features. Also examine data retention, export options, access controls, and integrations with your existing systems.
Let’s be honest: a modest tool that someone uses every week can deliver more practical value than an expensive platform nobody trusts. During a trial, ask the intended users to create a report, explain it, and identify a sensible next action.
Build a Small, Reliable Tracking Plan
Choose a few meaningful actions around one journey. A booking business might track a service view, a booking started, a time slot selected, and a booking confirmed.
Write down exactly what each event means. Does “booking confirmed” happen after payment succeeds, or when someone merely clicks the final button? That distinction changes the report completely.
Add useful context, such as service type or device category, while keeping sensitive information out of event properties. Review masking and exclusion settings before using session replay, and make sure collection follows your consent configuration and privacy requirements.
Now test the journey yourself. Complete a booking, abandon another, and check whether both appear correctly. Look for duplicate events, missing steps, and differences between mobile and desktop.
Keep a simple record of the event definitions and who owns them. When the website changes, that record helps the team update tracking before reports become misleading.
Turn a Finding Into a Test
Suppose your reports show a steep drop between selecting a service and choosing an appointment. Relevant recordings suggest that visitors struggle to find available dates.
Your hypothesis could be simple: showing the next available appointments immediately will help more people finish booking.
Choose a primary measure, such as confirmed bookings per visitor who starts the process. Watch related outcomes too, including cancellations, so an apparent improvement doesn’t hide a new problem.
Where traffic allows, compare the existing experience with the proposed change through a controlled experiment. With smaller audiences, combine observations, customer feedback, and carefully interpreted comparisons over time.
Avoid changing the calendar, pricing, button text, and page layout together. A focused change makes the result easier to interpret. Decide in advance how you’ll judge the evidence, and resist declaring success after a handful of encouraging bookings.
Read the Numbers With Some Caution
Your reports reflect the activity your setup captures. Consent choices, blocked scripts, and incomplete tracking can leave gaps. A customer switching devices may also appear as separate users unless your identification setup connects them appropriately.
Context matters just as much. A conversion increase during a sale may reflect discounted prices or different traffic. Compare similar periods and check which customer groups changed.
Be especially careful with small samples. If three of ten visitors purchase, the percentage looks impressive, but the next few visitors could change it sharply.
Treat unexpected results as questions to investigate. Check the tracking, inspect the relevant journey, and look for another explanation before making a major decision.
Make It a Useful Weekly Habit
Set aside a short weekly session to review one important journey. Look for a meaningful change, choose a focused question, and give someone responsibility for investigating it.
Keep a brief note of what you found, what you changed, and what happened afterward. Over time, that record helps you distinguish recurring problems from temporary noise.
The best customer behavior analytics tools earn their place through decisions they help you make. Start with a clear question, collect dependable evidence, and use it to remove one real obstacle for your customers.